
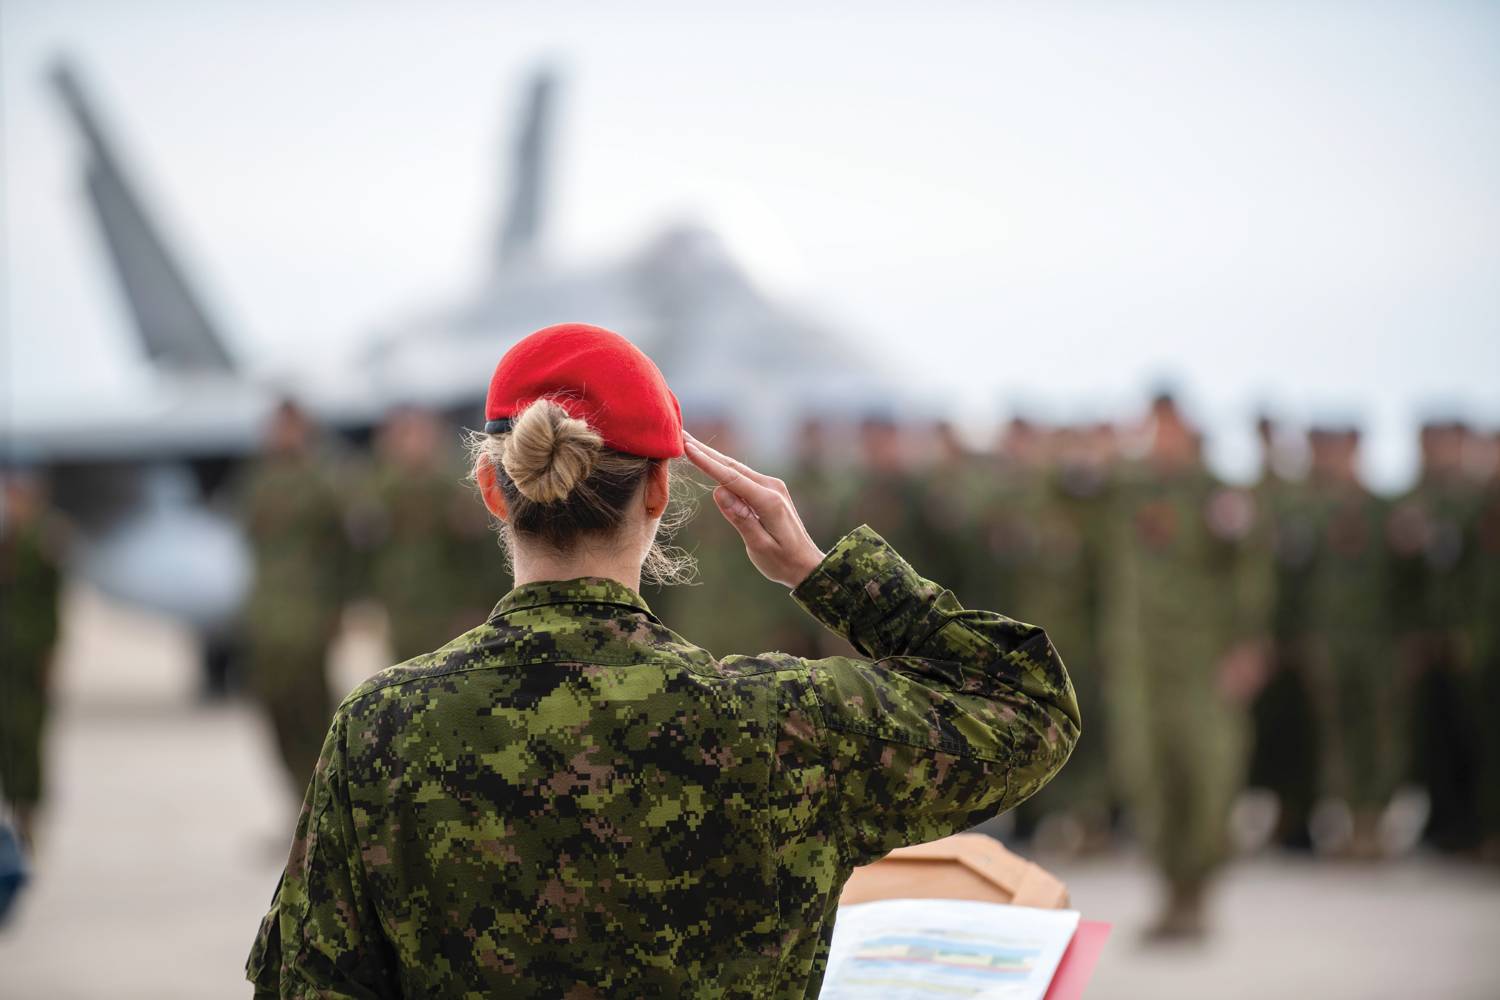
Photo: Corporal Eric Chaput, Canadian Armed Forces photo
Canadian Armed Forces members, members of the French Army, Romanian Air Force and guests from the United States Army attend a Remembrance Day ceremony at the Mihail Kogalniceanu (MK) Air Base in Romania, November 11, 2022 during Operation REASSURANCE.
Dr. Binyam Solomon is an Adjunct Research Professor of Economics at Carleton University, Ottawa, Canada. He has previously worked for the Department of National Defence and Defence Research and Development Canada (DRDC) as a Defence Science expert, acting Chief Scientist and Chief Economist.
Dr. Ugurhan G. Berkok is an Associate Professor of Economics at the Royal Military College of Canada and an Adjunct Professor at Queen’s University, Kingston, Canada.
Keith Hartley, one of the pioneers of defence economics, notes that “[The] task of the economist is to identify myths and special pleading, and subject them to rigorous and critical economic analysis and assess the supporting evidence.”Footnote1
Domestic debates about Canada’s role in the North Atlantic Treaty Organization (NATO) have often been clouded by myths, emotions, and special pleading, making it challenging to arrive at a balanced assessment of the nation’s contributions to the alliance. The debates have often revolved around two interrelated issues: first, Canada’s role in supporting NATO’s strategic goals through non-military means such as the Climate Change and Security Centre of Excellence in Montreal;Footnote2 and, second, a call for more complex burden-sharing metrics beyond the 2% of gross domestic product (GDP) defence spending target adopted at the 2014 Wales Summit. Specifically, Canada argued for the incorporation of specific outcome measures (deployment in NATO missions) and of regional contributions (such as those in the Arctic) into the burden-sharing calculations. These somewhat apologetic approaches seem to have come to an abrupt end in April 2025 with the new government in Ottawa. The Mark Carney government announced that Canada would reach the old 2% target in 2025, and it signed on to the new 3.5% of GDP defence spending target agreed upon at the recent NATO summit in The Hague, as well as the extra 1.5% on defence- and security-related areas. This is a drastic departure from the policies of the previous two Canadian governments since 2006.
This article offers a grounded exploration of Canada’s role within NATO through an analysis of this country’s evolving strategic priorities and budgets, which aims to explain its previous reluctance to meet the Wales Summit target of 2%, as well as its giant neighbour’s persistent reminders of the need to reinforce defence capabilities. The article then provides empirical findings on Canada’s defence burden within the North American theatre and for NATO commitments, its historical and contemporary defence spending trends, and its military readiness. Yet no new data on Canada’s defence spending will be available until fall 2025, when the new government will table its budget. The article ends with a short epilogue that attempts to explain the very recent elevation of defence to a higher-priority policy area.
Canada’s national defence policy
Threats and threat perceptions
The Canadian Defence Policy statement issued in April 2024 reiterated the country’s national security priorities, stated as Canada’s territorial integrity, North America’s borders and Canada’s international responsibilities, primarily towards and with NATO.Footnote3 Intriguingly, the statement used the expression “North American Arctic” rather than “Canadian Arctic,” presumably emphasizing the North American Aerospace Defence Command (NORAD) and hence acknowledging the security threat to the US posed by an unprotected Arctic. In this regard, it is important to mention that the modernized NORAD, by reducing response times and increasing the accuracy of northern anti-missile defences, will generate positive spillovers to European NATO partners by decreasing the likelihood that the US military might be confined to home defence and unable to intervene in the European theatre.
In this light, discussions about Canadian defence spending and particularly Canada’s burden-sharing within NATO seem to involve passionate debate, folklore, and lobbying among stakeholders, with less interest shown by voters, who are, as revealed by polls, preoccupied not with gun issues, but with mundane bread and butter issues, primarily housing and health care. It is no surprise, then, that there has been a “conspiracy of abstention” in our political sphere to avoid the perception of warmongering.
We propose a discussion rooted in public choice analysis based on the absence of any threat or perceived threat and on the structural weakness of the country’s defence procurement process due to Balkanized industrial and regional interests.
Chrystia Freeland, who occupied the high-ranking positions of Deputy Prime Minister and Finance Minister in the Canadian government from 2015 to 2024, summarized Canadian citizens’ thinking rather precisely in 2017: “Why do we spend billions on defence, if we are not immediately threatened? For some countries, Israel and Latvia come to mind, the answer is self-evident. Countries that face a clear and immediate existential challenge know they need to spend on military and foreign policy, and they know why. For a few lucky countries, like Canada and the United States, that feel protected by geography and good neighbours, the answer is less obvious. Indeed, we could easily imagine a few good Canadians who say that we are safe on our continent and we have things to do at home,Footnote4 so let us turn inward and say, ‘Canada first.’”Footnote5
Freeland’s accurate description is supplemented by the view of the Canada Business Council, the grouping which includes nearly all businesses in the country, that national security necessarily requires a defence industrial base. However, that view does not consider two important qualifiers. First, Canada is a member of NATO and, as such, can benefit from access to alliance members’ defence industrial bases. Second, the existing Canadian defence industrial base has developed expertise over seven decades of integration with its American counterpart based on relative efficiencies. These two facts suggest that Canada does not have to reinvent wheels by heavily subsidizing new defence sectors. The Council says, “A strong and sovereign defence industrial base will not only allow the government to safeguard Canadians and support our allies, but also supercharge Canada’s economic security and prosperity through increased innovation and job creation.”Footnote6 This economic nationalism, augmented by regionalism, is why Canadian defence procurement is so slow and inefficient in responding to procurement requirements. However, since the inauguration of President Trump, with his overt insistence on stronger defence spending in Canada, the election of the Mark Carney–led Liberals in April 2025, and the NATO summit in The Hague, Canada’s defence policy landscape has changed quickly and dramatically.
Since these changes will not translate into credible actions until the new federal budget comes down in October 2025, we will first concentrate on the recent past. Our analysis is rooted in the divergence between threats and perceived threats on the one hand, and the effect of economic nationalism that upsets efficient procurement of defence equipment on the other. Whereas Canadians do not expect to see missiles raining down or our infrastructure collapsing any time soon, either misperceiving threats or heavily discounting the possibility of the Arctic becoming a battleground for autocratic and belligerent powers, businesses would look through their own lens and focus on defence as generating business rather than defending our country against the threats. An institutionalized form of this powerful pressure group is Canada’s defence industrial policies, which make the process of equipment procurement more cumbersome. Faced with these perceptions, our political parties of all stripes played down threats to avoid losing votes and yielded to various interest groups by wasting taxpayers’ dollars in domestic defence equipment production rather than buying from efficient allied-country industries.Footnote7 Concerning major equipment procurement, Canadian defence industries developed as mostly second- and third-tier contractors for the US defence industrial base because of the 1950s Defence Production Sharing Agreements.Footnote8 In fact, Canada’s participation in the Joint Strike Fighter project in the late 1990s was a no-brainer in terms of development and manufacturing contracts awarded to Canadian industries. The subsequent purchase of F35s was an economically efficient decision and, in the light of future technological interoperability with the US in the context of NORAD, perhaps facilitated the decision.Footnote9
Objectives, budgets, and current efforts
The analysis of data since the early 1990s, when the country enjoyed the peace dividend, against the background of a painful major fiscal reset with a new government elected in 1993 reveals a flat defence expenditure curve.
Figure 1 shows a remarkably stable defence expenditure pattern, beginning with the deep budget cuts at every level of government and in every area of intervention from the landslide Liberal Party win in the 1993 election and continuing until 1997, when the federal budget was balanced for the first time since 1969. That period coincided with the peace dividend in the aftermath of the implosion of the Soviet Union. More recently, the stability of the Canadian defence expenditure has continued, with the lowest at 0.9% of GDP in 2014 under the Conservative Party and the highest at 1.3% in 2021, despite two major incidents: first, the missions in Afghanistan beginning in 2001, then the initial Russian invasion of Ukraine in 2014. NATO’s 2014 Wales Summit resolution on the 2% of GDP floor has yet to make a dent. However, after the 2% target was raised to 3.5% at The Hague Summit, the new government stated that 2% will be achieved in 2025. The fall 2025 budget will severely test the credibility of that statement.
Figure 1: Canada’s defence burden trend, 1951–2023

Sources: SIPRI (2024);Footnote10 authors’ calculations.
The remarkable stability of Canadian peace dividend defence spending was not perturbed by any of the nine elections (held in 1997, 2000, 2004, 2006, 2008, 2011, 2015, 2019, and 2021, with the party in power changing twice); by a 13-year deployment in Afghanistan (with nine different operations)Footnote11 or by a 10-year-old continuing deployment in Latvia. The recent defence policy updateFootnote12 in May 2024 reiterated unchanged priorities regarding Canadian sovereignty, with further emphasis on the Arctic,Footnote13 given climate-change-augmented Russian and Chinese activities; the defence of North America, with the upcoming NORAD modernization coming to the fore; and Canada’s traditional global responsibilities. Unsurprisingly, though, the April 2025 election upended the weak defence spending inertia.
Canada and the Atlantic Alliance
In addition to several deployments that include the Freedom of Navigation multi-country mission through the South China Sea, Canada currently deploys alongside NATO allies to support Ukraine and the Baltic republics. The deployment to Ukraine, Operation UNIFIER, with 350 personnel, is training Ukrainian forces in various areas. Operation REASSURANCE in Latvia is a full deployment, soon to reach 2,200 personnel, and can be called an extended deterrence force at the brigade level together with some other NATO countries’ armed forces. Both of these deployments are NATO collective security missions against a belligerent Russia.
If we look at the current Canadian Armed Forces (CAF) deployments in Canada and abroad,Footnote14 the picture that emerges is that of a country actively involved in significant but limited peace and stability operations around the globe. These Canadian deployments are not pivotal,Footnote15 in the sense that, for the given mission, the Canadian contingent’s incremental contribution is weak, unlike Canada’s contribution in Latvia as part of Operation REASSURANCE. Despite the significant effectiveness of these deployments, current defence spending is insufficient to allow any surge in capabilities.
The empirics of burden-sharing
Definitions and measurement issues
We begin our empirical analysis by addressing key issues related to measurement and definition that are central to the economic analysis of the burden-sharing debate. First, comparisons between countries require a consistent definition of military expenditures. Second, the comparisons must be standardized using a common metric, such as monetary units and a uniform base price. Third, the validity, reliability, and comparability of the measurements must be ensured by verifying the consistency of definitions, the appropriateness of monetary and price units, and the practicality of the chosen methodology.Footnote16 Critics who rely on national definitions and augment security spending to inflate the share of military expenditure relative to GDP often overlook these important considerations.Footnote17
While no measurement method fully meets these stringent requirements, defence economists commonly adopt the NATO definitionFootnote18 of military expenditures and use the US dollar as a standardized monetary unit, with prices adjusted for inflation based on each country’s economy-wide price index. Each member’s military spending under this framework is referred to as indirect NATO funding. Additionally, NATO is supported by direct contributions that fund and maintain the civil budget (e.g., NATO Headquarters), the military budget (e.g., NATO Command Structure), and the NATO Security Investment Programme (e.g., military infrastructure and capabilities).
The latter funding amounts to approximately €3.9 billion and is allocated based on an “ability to pay” assessment scale. However, the fact that member states contribute their fair share to the common budget—equivalent to only 0.28% of the Atlantic Alliance’s total military spending—does not, and should not, resolve the burden-sharing debate. It is also important to note that military expenditure, as a resource input measure, does not necessarily reflect military output. Nevertheless, it provides a reasonable indicator of a nation’s ability or willingness to contribute financially.
When NATO was founded, its membership consisted of 12 nations with relatively similar military doctrines, economic systems, and standards of living. At the time, measures such as the share of military expenditure relative to GDP or gross national product, or informal agreements to allocate a specific portion of national income to defence, had merit. However, as the alliance has expanded from 12 members to its current 32, encompassing countries with diverse economic sizes, systems, and doctrines, these traditional measures have become increasingly challenging to apply effectively.
As noted earlier, the economics of alliancesFootnote19 suggests that burden-sharing imbalances can be mitigated if smaller allies are incentivized to contribute more to the alliance, consistent with the burden-sharing thesis developed by Berman and Berkok.Footnote20 NATO’s adoption of the flexible response doctrine in the late 1960s illustrates this point. The doctrine required nations to maintain a full spectrum of forces, both conventional and strategic (nuclear).
Since conventional forces must be deployed to support both the alliance and the national territories, countries were compelled to invest in self-protection. Those investments often yielded additional country-specific benefits, such as national search and rescue capabilities and support for civil authorities. The more such benefits a nation derives from defence spending, the more likely it is to fund those activities, thereby reducing the prevalence of free riding by smaller nations.
Empirical approaches to testing alliance economics
To examine the key findings of the military alliance and collective action literature, economists typically employ two approaches:
-
Non-parametric rank correlation testsFootnote21
This approach assesses whether the benefits and costs of alliance membership are equitably distributed. Specifically, it uses the proportion of a nation’s military expenditures relative to the alliance as a measure of burden or cost. For benefits, proxies such as a member country’s GDP, population, and exposed borders are averaged.Footnote22 -
Parametric demand models
This approach models the demand for military expenditures, assuming that countries act as unitary agents seeking to maximize the benefits of defence spending within their budgetary constraints. It incorporates factors such as fiscal resources, security environments (threat levels and alliance contributions), and political limitations. Using advanced regression techniques, these models evaluate whether the alliance contributions are optimal or whether extensive free riding occurs.
Non-parametric analysis
The results of non-parametric tests reveal strong evidence of shifting burden-sharing dynamics. During NATO’s Mutual Assured Destruction era, exploitation (free riding) was prevalent, while the Flexible Response era saw fairer burden sharing. However, free riding re-emerged during the 2010s, particularly after Russia’s annexation of Crimea. These tests highlight Canada and certain European members as serial free riders, with their relative benefits far outweighing their burdens.
European and Canadian researchers have proposed modifications to the above-mentioned approaches, in order to better align benefit and burden proxies with actual contributions to the alliance.Footnote23 For example, Canada, with the world’s longest coastline and second-largest total area, is disproportionately disadvantaged by the “exposed border” proxy. It has been suggested that the weighting scheme for this benefit measure be adjusted. Without the exposed border proxy, Canada’s relative benefit share decreases from 20% to about 4%, which, while still high, is more reasonable. Table 1 illustrates this impact.
| Year | Relative burden share | Relative benefit share | ||||
|---|---|---|---|---|---|---|
| Economy (GDP) | Population | Exposed borders | Average | Excluding borders | ||
| 1961 | 1.96% | 3.94% | 3.65% | 63.03% | 23.54% | 3.79% |
| 1970 | 1.39% | 4.22% | 3.88% | 63.03% | 23.71% | 4.05% |
| 1980 | 2.28% | 4.56% | 4.13% | 63.03% | 23.91% | 4.35% |
| 1985 | 1.84% | 4.43% | 3.97% | 62.42% | 23.61% | 4.20% |
| 1991 | 1.96% | 4.15% | 4.10% | 62.42% | 23.56% | 4.13% |
| 2000 | 1.85% | 4.19% | 3.89% | 61.69% | 23.25% | 4.04% |
| 2010 | 1.54% | 4.24% | 3.78% | 59.17% | 22.40% | 4.01% |
| 2015 | 1.99% | 4.31% | 3.88% | 37.55% | 15.25% | 4.10% |
| 2020 | 2.16% | 4.25% | 4.02% | 37.50% | 15.26% | 4.13% |
| 2021 | 2.15% | 4.22% | 4.04% | 37.50% | 15.25% | 4.13% |
| 2022 | 2.11% | 4.26% | 4.09% | 37.50% | 15.29% | 4.18% |
| 2023 | 2.14% | 4.21% | 4.17% | 37.41% | 15.26% | 4.19% |
Expanded burden and benefit measures
Recent studies have refined these analyses by incorporating additional variables, such as transnational terrorism exposure for benefits and Overseas Development Assistance and United Nations (UN) peacekeeping contributions for burdens. These expanded measures reduce but do not eliminate free riding. Military expenditures remain significantly larger than these added measures, sustaining the burden-sharing debate.Footnote24
Further studies have included contributions to international initiatives such as the UN Environment Programme and the World Health Organization. While these contributions exhibit cooperative behaviour and reduce free riding in non-military domains, they fail to resolve the issue within NATO.Footnote25 The cooperative response in these cases may stem from the linkage to GDP or from the desire among wealthier nations to match or exceed contributions for status and reputational reasons. Economic principles suggest that the private benefits accruing to individual member states further incentivize such contributions.Footnote26
Parametric analysis using demand models
The evidence from demand models is more ambiguous for Canada. Table 2 summarizes findings from studies conducted between the 1980s and 2022. Earlier studies indicate greater alignment in NATO burden-sharing, including Canada’s contributions, but later findings are less definitive. A 2005 study by Solomon notes that from 1952 to 1970 Canada responded positively to US military spending. However, Canada’s overall defence posture was driven primarily by inertia, with current budgets reflecting prior-year expenditures.
| Author and study | Theoretical model | Sample period and variables | Results |
|---|---|---|---|
| Murdoch & Sandler (1982) | Joint Product Model – spillins and substitution effect | 1964–1979. Variables include GDP, thin, spill and strategic proxy | Canada is a free rider (10% significance) |
| Gonzalez & Mehay (1990) | Test both the Joint Product Model and the Exploitation Model | 1974–1984. Variables include per capita income, population | No exploitation in NATO. No country-specific information |
| Murdoch & Sandler (1991) | Test the behaviour of NATO, i.e., Lindahl or NashCournot | 1955–1987. Variables include GDP, spill, threat | Canada not a free rider (5%) |
| Murdoch et al. (1991) | Test Oligarchy vs Median Voter specification | 1965–1988. Variables include spill, per capita income, tax rate | Canada not a free rider (5%) |
| Hansen et al. (1991) | Joint Product Model: strategic and non-strategic expenditures | 1970–1985. Variables include GDP, conventional and strategic spills – Canada included | Canada not a free rider (5%) |
| Hilton & Vu (1991) | Pure Public Model | 1960–1985. Variables include Warsaw Pact defence expenditures, NATO ally’s GDP and population | Canada’s spill-in response positive and threat negative |
| Conybeare et al. (1994) | Best shot versus Weakest Link specification | 1961–1987. Variables include GDP, threat and defence expenditures of the weakest ally (Denmark) and strongest (US) | Inconclusive results, NATO and Canada; neither specification was significant |
| Solomon 2005 | Joint Product Model – spill-ins and substitution effect | 1952–2001 | Spill-in from Europe + not significant for US |
| Douch & Solomon 2014 | Panel, SURE estimate | 1955–2007 | positive US and GDP |
| Skogstad & Compton 2022 | Hybrid | 1990–2019 | Canada a free rider (1%) |
Source: Solomon (2005).Footnote27
After the 1970s, rising non-defence priorities and increasing relative prices suppressed Canadian defence spending. Moreover, Canada’s defence expenditure demonstrates only a weak long-term relationship with GDP, highlighting limited public support for increased military funding. Canadian spending appears to react to NATO allies’ expenditures, potentially as indirect threat signals. This complicates the distinction between cooperative spill-ins (reacting positively to ally spending) and reactive responses to perceived threats.
A 2022 study by Skogstad and Compton underscores Canada’s post–Cold War spending decline and provides strong evidence of free riding.Footnote28
The 2% guideline
NATO’s Wales Summit decision on boosting defence expenditures over a floor of 2% of GDP may have usefully generated a clear, achievable goal based on the alliance’s definition of the defence expenditureFootnote29 for member countries. Moreover, the target was achievable in the short run, as two thirds of member countries had already reached the 2% floor as of 2024. By the Canadian government’s own admission, Canada’s expenditure is unlikely to reach that level any time soon.
After a leaked report revealed that Prime Minister Justin Trudeau had, on July 11, 2024, privately admitted to NATO allies that Canada would not meet the 2% target,Footnote30 the Government of Canada announced its commitment to meet the military spending target of 2% of GDP by 2032Footnote31—almost two decades after NATO’s 2014 Wales Summit.
Recall that Figure 1 shows Canada’s defence burden (military expenditures as a percentage of income [GDP]) for the period from 1951 to 2023. According to the data, Canada met the 2% guideline for most of the Cold War period. After the Cold War, Canada’s oversized expectations of a peace dividend, together with fiscal and economic constraints, led to a 25% real (inflation-adjusted) reduction in military spending. Since those cuts, which started in 1992, Canada has yet to achieve the 2% target.
Regarding Canada’s ability to reach the 2% target by 2032, the Parliamentary Budget Officer (PBO) is skeptical.Footnote32 The government’s own analysis assumes that nominal GDP will grow by less than 2% (implying that real economic growth will be negative for the next three to four years!) and that therefore a defence-to-GDP ratio of 1.76% will be achieved by 2029–2030. The PBO, using similar GDP forecasts from other sources, finds the ratio to be a modest 1.58%, which implies the need to double defence spending from the projected 2024–2025 budget of $41 billion.
In Table 3, the analysis is replicated and extended, using the data provided by the Department of National Defence (DND) for the period 2017–2018 to 2029–2030. If we assume that, during that period, the Canadian economy will grow nominally by 3.8% (the average of private-sector forecasts used by the Government of Canada in Budget 2024), the share of defence spending as a percentage of GDP will equal 1.58% in 2029–2030. This is identical to the PBO’s finding. Similarly, if we extend the analysis to 2032–2033, the fiscal year in which the government is committed to spend 2%, the defence budget must equal $81.7 billion. In other words, from the current fiscal year of 2024–2025 to 2032–2033, DND needs to spend an average of $11.45 billion annually in addition to its announced commitments. The recent NATO commitment to increase the guideline to 3.5%, made at the June 2025 Summit in The Hague, further accentuates the fiscal challenges.
| Actual | SSE 2017 | ONSF 2024 | Other para-military* | Projected MilEx | Projected burden share | Wales Summit target | |
|---|---|---|---|---|---|---|---|
| 2017–18 | 22,877 | 20,682 | 7,884 | 30,761 | 1.42% | ||
| 2018–19 | 21,616 | 21,428 | 7,409 | 29,025 | 1.29% | ||
| 2019–20 | 22,839 | 21,714 | 7,109 | 29,949 | 1.30% | ||
| 2020–21 | 26,827 | 24,276 | 4,462 | 31,289 | 1.39% | ||
| 2021–22 | 24,126 | 25,314 | 7,850 | 31,976 | 1.23% | ||
| 2022–23 | 26,930 | 26,048 | 6,777 | 33,707 | 1.19% | ||
| 2023–24 | 33,469 | 29,879 | 7,906 | 37,785 | 1.29% | ||
| 2024–25 | 31,741 | 43,800 | 7,300 | 41,100 | 1.36% | 19,529 | |
| 2025–26 | 31,931 | 44,200 | 8,100 | 52,300 | 1.66% | 10,633 | |
| 2026–27 | 32,673 | 44,600 | 8,600 | 53,200 | 1.63% | 12,124 | |
| 2027–28 | 33,404 | 45,000 | 8,500 | 53,500 | 1.58% | 14,306 | |
| 2028–29 | 31,474 | 46,000 | 8,900 | 54,900 | 1.56% | 15,483 | |
| 2029–30 | 30,528 | 49,500 | 8,300 | 57,800 | 1.58% | 15,258 | |
| 2030–31 | 65,584 | 1.73% | 10,250 | ||||
| 2031–32 | 73,215 | 1.86% | 5,500 | ||||
| 2032–33 | 81,707 | 2.00% | 0 |
Sources: Authors’ calculations; Our North, Strong and Free.Footnote33
Summary of empirical findings for Canada
-
Concordance between benefits and burden
Analyses assessing the alignment of benefits and burdens within NATO consistently identify Canada as a serial free rider, with the benefits it reaps far exceeding the burdens it shoulders. These findings are influenced by benefit measures that include exposed border proxies, which disadvantage Canada due to its vast size.Efforts to extend and refine both burden and benefit measures have yet to fully address this disadvantage. Although removing the exposed border proxy marginally improves Canada’s standing, the overall impact remains limited.
-
Demand-based models
Results from demand-based models are often ambiguous for Canada, particularly in studies focusing on the Cold War period or those with samples heavily weighted toward it. However, studies examining the post–Cold War era consistently depict Canada as a free rider within the alliance.
Beyond budgetary effort: In-kind contributions, infrastructure, committed troops
Despite these findings, Canada has actively participated in several NATO-sponsored or -led missions, often selecting the most challenging deployments. A notable example is the 2005 deployment to the volatile Kandahar region in Afghanistan. Such tangible contributions to NATO and UN peacekeeping missions are frequently cited to challenge the “free rider” label.
These outcome-based measures are significant because the marginal costs of producing defence capabilities vary among nations. Canada may possess a comparative advantage in generating specific capabilities that are particularly valuable to the alliance. However, estimating military outcomes or outputs is inherently difficult when the objectives—such as deterrence or defending broad regions like Europe or North America—are abstract.
The more pressing question, given the evolving security environment, is whether Canada is equipped to address emerging threats, including those in the Arctic, which affect not only North America but also the European Arctic countries: Denmark, Finland, Iceland, Norway, and Sweden.
Canada’s post–Cold War posture
An examination of Canada’s military expenditures provides preliminary insights into its preparedness for new and emerging threats. Figure 2 shows the inflation-adjusted growth in military spending by DND and the CAF since 1991, marking the end of the Cold War. Using 1991 as the baseline, the trend traces spending growth over the subsequent decades.
Figure 2: Real (inflation-adjusted) growth in military expenditure, 1991–2023
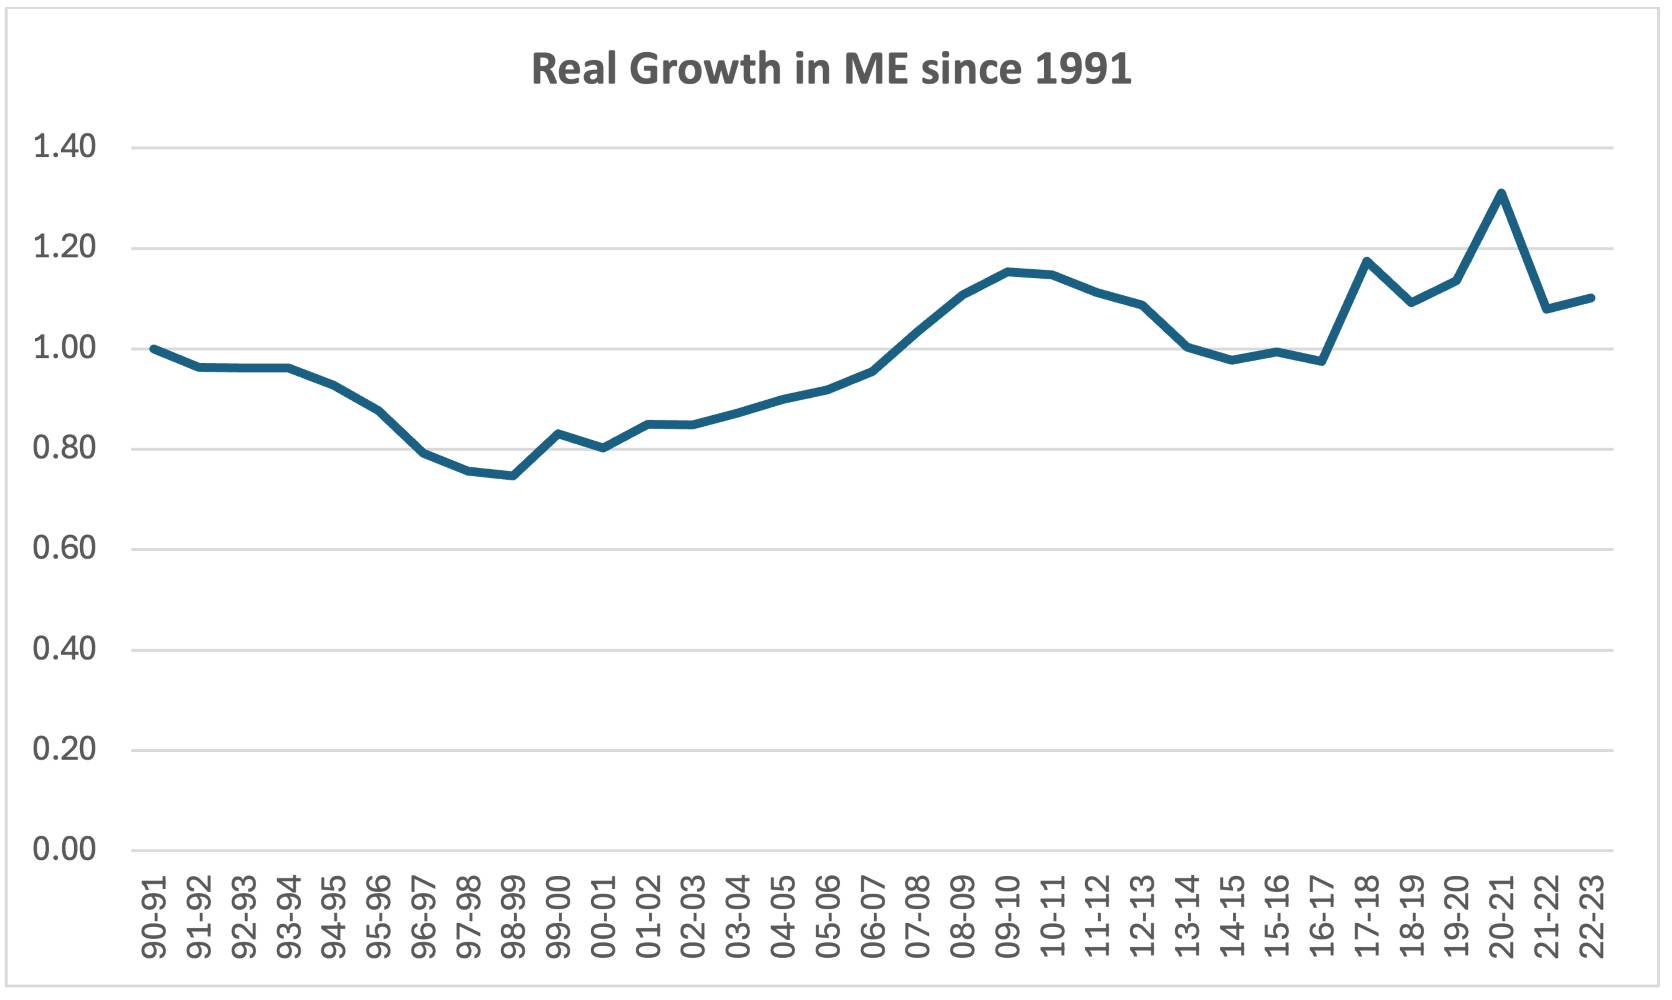
Sources: Stockholm International Peace Research Institute (2024); authors’ calculations.
- From 1991 to 1998–1999, military spending contracted sharply, reflecting efforts to reduce federal debt through austerity measures. By 1998–1999, DND/CAF spending had declined to 25% below its 1990 level.
- Recovery began in the 2000s, with spending reaching its 1990 level in 2007–2008, supported by budgetary surpluses and the CAF’s significant deployment to Kandahar.
- Spending peaked at 15% above 1990 levels in 2009–2010 but fell below 1990 levels again by the mid-2010s. Currently, military expenditures are about 10% above their 1990 level.
Over the 33 years since the Cold War, the compound annual growth rate of DND/CAF spending is a modest 0.29%. Defence spending, which accounts for roughly one-quarter to one-third of discretionary spending, is frequently reduced during periods of austerity. While not an outcome measure, this sluggish growth in inputs undermines confidence in Canada’s readiness to address emerging threats or contribute to future deployments.
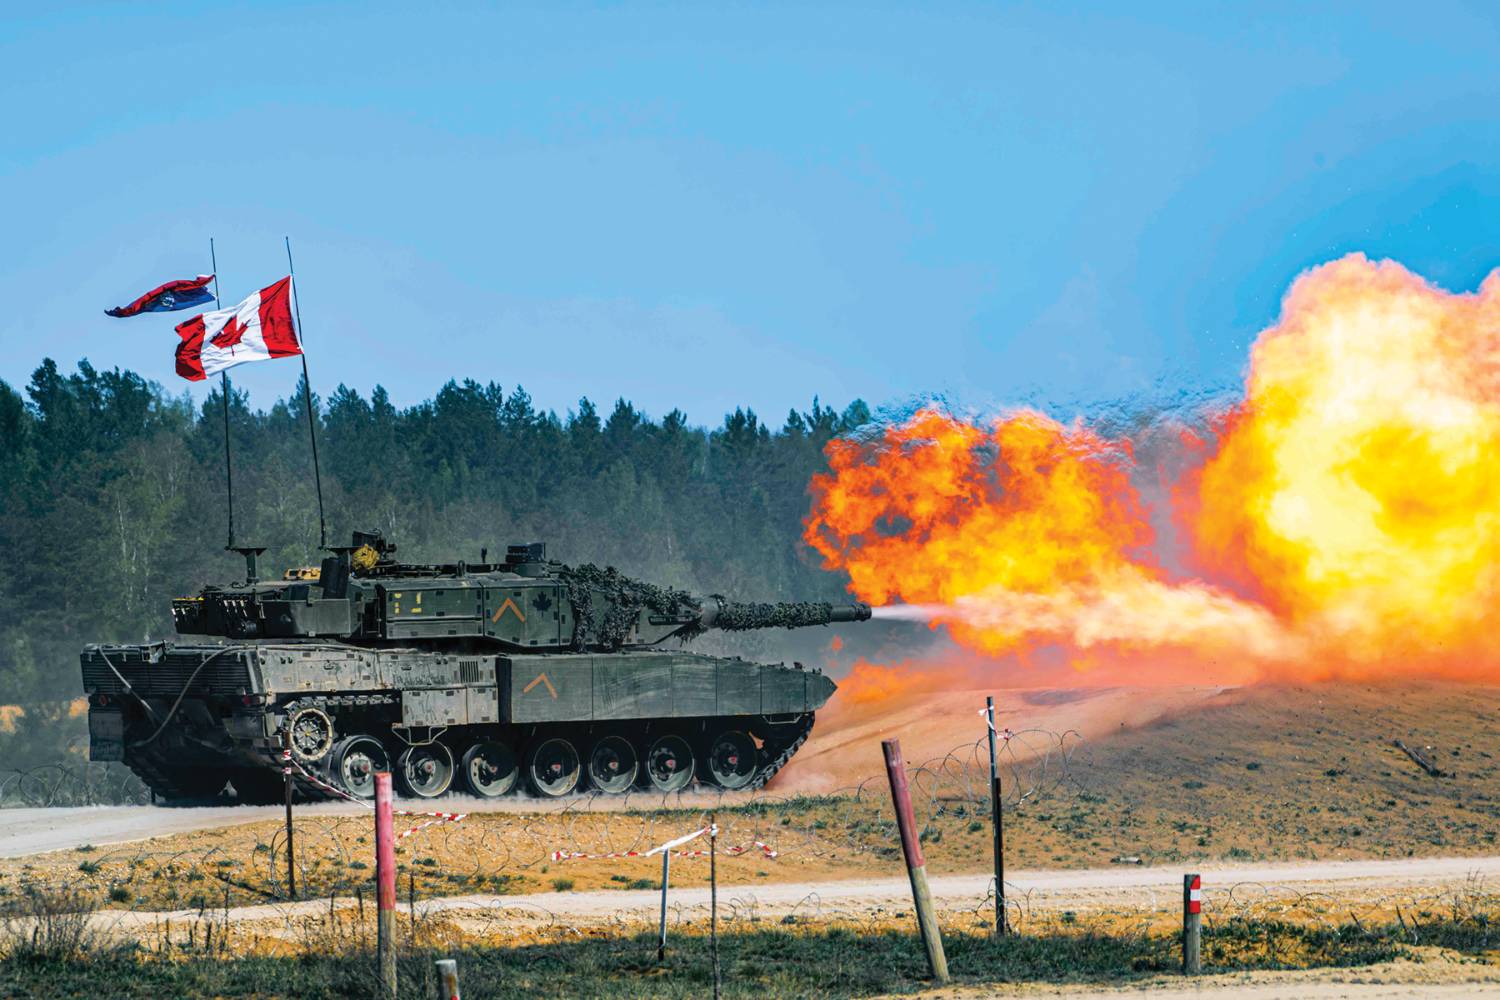
Photo: Corporal Bryan Bodo, Canadian Armed Forces Imagery Technician
A Canadian Leopard 2 tank with The Royal Canadian Dragoons take part in the Canadian Army Trophy tank gunnery competition during Operation REASSURANCE at Camp Adazi, in Latvia, on May 2, 2024.
Trends in personnel and capital investments
A disaggregated analysis of military spending—focused on personnel, capital, and research and development—can provide indirect indicators of military readiness. These components strongly correlate with outcome measures such as deployable force levels.Footnote34 Figure 3 shows trends in personnel strength and capital investment (as a share of total spending) from 1972–1973 to 2022–2023.
Figure 3: Trends in personnel–capital substitutions

Source: Stockholm International Peace Research Institute (2024); authors’ calculations.
- The analysis begins in the aftermath of the 1971 White Paper, which cut Canada’s forces in Europe by half and eliminated the country’s aircraft carrier capability. By 1971, capital spending had fallen to 9% of the budget, the lowest level since World War II.
- Despite these reductions, personnel levels remained stable, and capital spending rose sharply, reaching almost 29% by the mid-1980s. These investments enabled Canada to maintain a European presence and contribute significantly to UN peacekeeping missions.
Post–Cold War reductions, however, were more severe and consequential. Both personnel strength and capital spending were sharply curtailed in the 1990s and have not returned to 1990 levels. These reductions affected military occupational classifications and key capabilities. Some capabilities—such as tactical lift and direct fire—were partially restored through special spending provisions, known as Unforecasted Operational Requirements (UORs), to support operations in Kandahar.
The divergent procurement strategy outlined above is vividly demonstrated in the PBO’s study on capital spending trends. According to the study, from 2017–2018 to 2022–2023 there was a cumulative shortfall of nearly $12 billion between actual capital spending and the levels originally planned under the 2017 Defence Policy.Footnote35 Our revised analysis, using the latest publicly available data, estimates this shortfall to be $16 billion. Additionally, the recently announced commitments to NORAD, which allocate approximately $51.5 billion for systems and infrastructure upgrades,Footnote36 are expected to further constrain procurement schedules and reduce purchasing power.Footnote37
Canada’s success in Afghanistan was thus heavily reliant on UORs and primary reserves. However, the lack of sustained investment in personnel and capital since Afghanistan has undermined future readiness and complicated discussions with allies, particularly with the US administrations, even before the Trump presidency.
Conclusions and an epilogue
The full invasion of Ukraine in 2022, with the horrifying Russian objective of obliterating Ukraine, a flourishing democracy, reminded us that alliance members’ 2014 Wales Summit decision to set a 2% floor for defence expenditures was an accurate forecast of what was to come. In 2023, the Vilnius Summit decision that the 2% was now a floor left a few members in dire need of catching up.
Canada, still stuck at 1.31% as of 2024, is also being criticized by the US. In May 2024, a bipartisan group of 23 US senators co-signed a letter to then Prime Minister Justin Trudeau indicating their “concern” about Canada’s defence spending falling well short of the NATO target floor of 2%.Footnote38 The new Trump administration has been rather blunt, going beyond the traditional nudges of previous administrations and the tone of the senators’ letter. However, the domestic resistance to defence expenditure increases, rooted in voters’ perception of weak threats and the electorally motivated cognitive dissonance on the part of Canadian political parties, was not expected to wither away any time soon. Until, of course, the April 2025 election!
What explained that lack of interest in and complacency about matters of national defence, given Canada’s oversized contributions during the First and Second World Wars? Some of the public choice perspectives and the empirics of the pre– and post–Cold War military postures discussed in this article provide partial answers. Future studies should examine more formally how inertia in military capabilities affects battlefield impact and readiness, and how some countries maintain military traditions, and respect for them, despite declining clear and present threats or long periods of peace.
However, the course of post–Cold War history changed drastically beginning at the 2007 Munich Security Conference with Vladimir Putin’s resentful speech. His pivot to autocracy began in 2008, when his presidential swap with Dmitry Medvedev signalled his intentions. Invasions of Georgia, Crimea, and Eastern Ukraine followed, culminating in the full invasion of Ukraine. NATO’s defensive awakening started with the 2014 Wales Summit, and The Hague Summit in 2025 punctuated the transition towards a complete “elbows up” effort by almost all NATO countries. Including Canada?